Conversation with Dr. Luis Suárez Ognio, Vice Minister of Public Health, Peru
Accurate and timely data on death—understanding how, where and when people have died—is invaluable for governments as they develop lifesaving public health measures. Since 2016, Vital Strategies’ Data for Health initiative has collaborated with the Peruvian Ministry of Health to support government efforts to strengthen online registration of vital events, including birth and marriage, and improve cause-of-death certification. Since the initiative began, death registration reporting increased substantially across the country, and the timeliness of when mortality data becomes available to the central government has improved dramatically.
With the emergence of COVID-19, we have worked with country partners to implement rapid mortality surveillance: comparing current death rates with historical rates in an effort to measure excess mortality and the impact of the national epidemic. This task has been made easier thanks to in-depth analysis of the leading causes of death over 30 years, conducted by Peru’s Centro Nacional de Epidemiología, Prevención y Control de Enfermedades (Peru CDC) with support from the Data for Health initiative. The confluence of strong government leadership and availability of historical baseline information has allowed mortality data to become a key surveillance tool for guiding the government’s public health response to COVID-19.
To learn more, the Data Impact program’s Director, Cynthia Driver, and Technical Advisor, William Valdez, spoke with Dr. Luis Suárez Ognio, Vice Minister of Public Health since August 2020. Dr. Ognio is also a professor of public health and epidemiology at Peruvian University of Applied Sciences, and a former director of Peru CDC.

“The way we do epidemiological surveillance has changed. Before COVID-19, mortality was analyzed by epidemiologists only for special studies—health situation analyses, burden of disease and specific causes of mortality. Now, in addition to notifiable case reports, mortality surveillance is a tool that epidemiologists use.”
Dr. Luis Suárez Ognio, Vice Minister of Public Health, Peru
How does the Ministry of Health use excess mortality data? What types of audiences are they shared with?
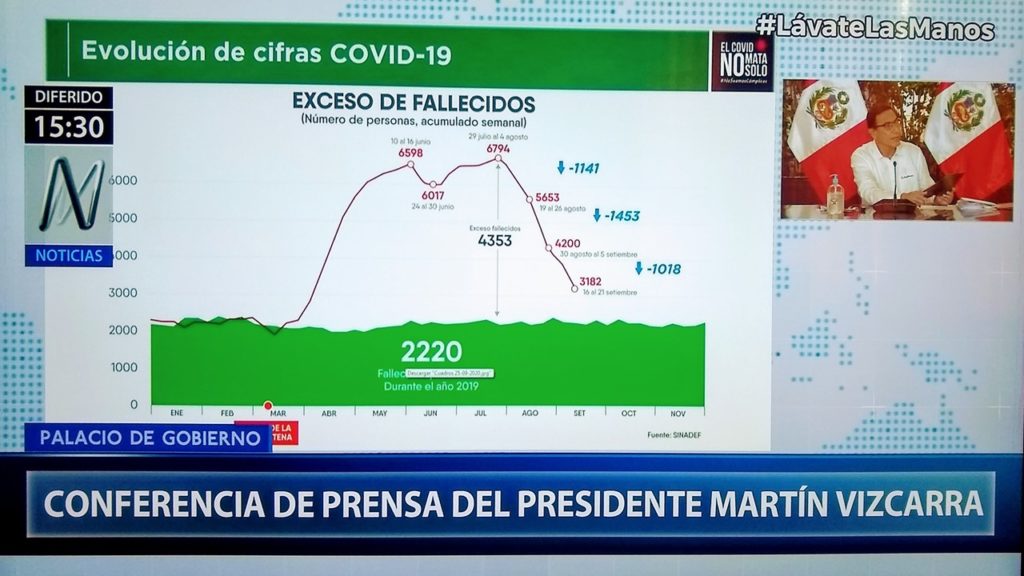
I meet with Minister of Health Pilar Mazzetti on a daily basis and with President Martín Vizcarra once a week. During these meetings and those with all government ministers, we use excess mortality data to understand our country’s COVID-19 situation. It has been a learning process to communicate the data in both technical and political language. We have leaned into the value of excess mortality data as a timely source of information, which helps determine the trend of the health challenge and helps us make informed decisions.

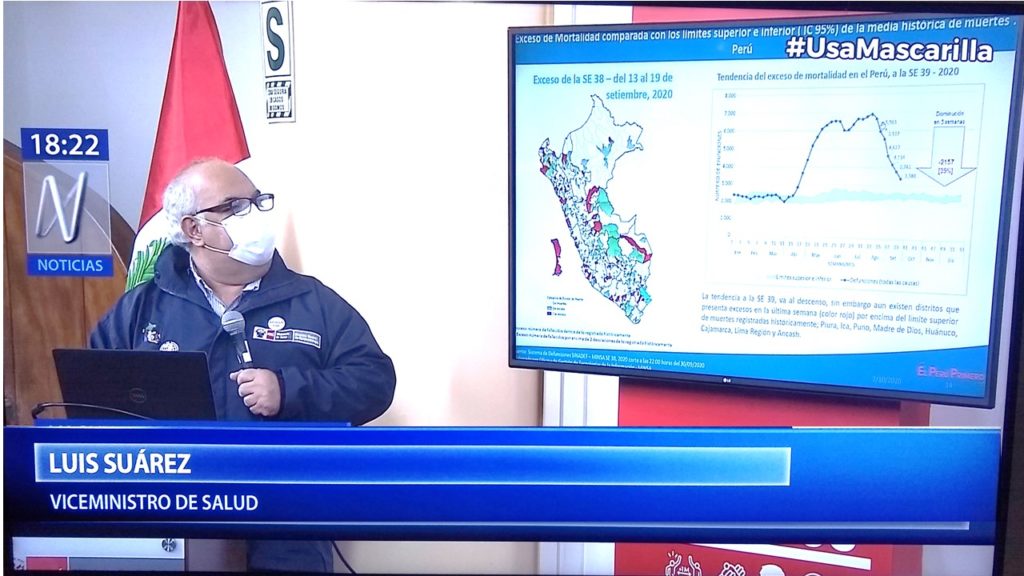
To the media and the general public, we not only show the figures, but also take the opportunity to routinely explain the significance of the indicators. In my first press conference in this role, I showed the excess mortality graphs and explained what this method was about, highlighting the usual rates of mortality and what the increase in mortality has been. I pointed out that not only is this excess mortality due to COVID-19, but also the indirect impact of the pandemic on other diseases and health challenges. We now include information on excess mortality in weekly press conferences.
In order to make sure excess mortality data is also disseminated within each region of the country, a new national directive was issued on Nov. 3 that considers death certification through our National Death Information System, SINADEF, as part of the epidemiological surveillance system. These two sources of data were considered separate until about a month and a half into the epidemic in Peru, at which point the SINADEF registry was capturing more information on mortality than the surveillance system itself—largely thanks to the support of Vital Strategies’ Excess Mortality Calculator.
With this kind of dissemination, we hope that excess mortality will become a clear and well-positioned concept that serves not only for monitoring COVID-19, but as a long-term tool to address all health problems in Peru.
Vital Strategies developed the Excess Mortality Calculator to help governments create more complete picture of the human toll of COVID-19, beyond looking at confirmed cases and deaths alone. It’s been incredible to see the Ministry of Health’s General Office of Information Technology adapt and improve upon this methodology. When you receive updated rapid mortality surveillance reports, what is the first thing you look for?
Peru’s online death registration system (SINADEF) is characterized by high registration levels. Upon assuming the position of Vice Minister of Public Health, I found that one of the benefits of the SINADEF information was the ability to evaluate excess mortality during the pandemic in near real time. The General Office of Information Technology provides me with a daily report on the deaths that have occurred in the previous 24 hours, at the national level and disaggregated for each department, province and district in the country.
I first look for the places where excess mortality is still high. This has become an extremely useful indicator, allowing us to pinpoint the locations with consistently high rates of mortality to direct prevention and control measures to those areas.
How has rapid mortality surveillance informed your decision-making?
Government decisions during the pandemic are dynamic and are adjusted according to the epidemiological situation. Excess mortality data has informed decisions on which areas in the country must remain in quarantine and where measures can be lifted—thereby targeting measures to only those provinces or districts where they are needed. Excess mortality analysis has also been used to determine when a curfew is needed, or the start or delay of each phase of economic reopening.
An intervention called Tayta Operation—which is a multisectoral joint operation between the Ministry of Health, the Ministry of Defense and other ministries—is another example of decision-making informed by mortality surveillance data. The objective is to identify elderly residents and families most vulnerable to infection (due to their health or economic status), to provide necessary support and protect them from illness and death. The operation targets districts where excess mortality remains high with no indication of decreasing.
Being able to measure the gap between observed mortality and historical mortality in recent years is critical. We are fortunate to have information from 2017 to 2019 registered in SINADEF, which has served as a baseline and allows us to measure this gap. Without this data, we would have been making decisions blindly.
“I remember the A/H1N1 epidemic in 2009. It seemed like a dream when I saw how other countries in Europe had daily information on excess cases and deaths and could know what was happening in their regions. Now it is a reality for our country.”
DR. LUIS SUÁREZ OGNIO, VICE MINISTER OF PUBLIC HEALTH, PERU
Can you give an example where mortality surveillance data has influenced a decision or action and had a positive impact on people?
As in other countries, we have been under pressure from mayors, governors and national ministries to return to economic normality; especially to open up public transport and interprovincial travel. While certain economic activities were permitted to resume at the close of the first wave of COVID-19 in our country, ongoing analysis of mortality data made it clear that we needed to reverse course to stem a subsequent increase in new cases. This also allowed us to avoid a greater burden on the health system in these locations and to bolster the capacity of hospitals located in areas where excess mortality was on the rise.
Access daily situational reports and excess mortality data from Peru: https://www.dge.gob.pe/portalnuevo/covid-19/covid-cajas/situacion-del-covid-19-en-el-peru/
The Data for Health Initiative is a global effort supported by Bloomberg Philanthropies and the Australian Department of Foreign Affairs and Trade. It provides technical assistance to low- and middle-income countries worldwide to improve public health data systems at the national level, including improving civil registration and vital statistics systems, maximizing the use of data to enhance public health policymaking and decision-making, establishing and strengthening national cancer registries and more. Vital Strategies serves as an implementing partner.